 GpRegressNd ND Gaussian Process Regression
=GpRegressNd(Variogram, Scaling, xValues, fValues, errValues, xStar,
RangeOrBeta, SillOrAlpha, Nugget, CalcError)
Parameters
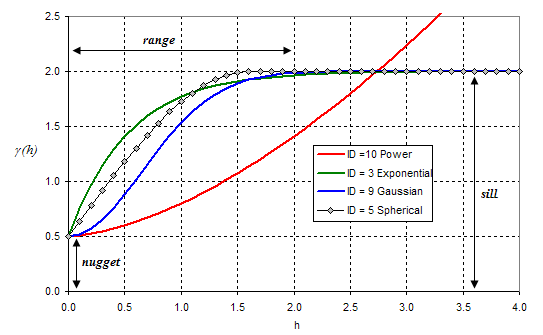
Variogram: (see Variograms section for details)
- 3 = Exponential
- 5 = Spherical
- 9 = Gaussian
- 10 = Power
Scaling: Scaling of parameters
- 0 = If parameters are homogeneous (no scaling)
- 1 = If parameters are NOT homogeneous (e.g. for black box model)
xValues: Function parameters values
fValues: Function values
xStar: Parameters value(s) to interpolate
errValues: Function estimated error(s). A unique value or one value per function value
RangeOrBeta: [Optional if Variogram=10] Distance in which the difference of the variogram from the sill becomes negligible (Range) or exponent of the power variogram (β)
SillOrAlpha: [Optional if Variogram=10] Limit of the variogram tending to infinity lag distances (Sill) or power variogram constant (α)
Nugget: [Optional] Height of the jump of the variogram at the discontinuity at the origin (default = 0)
CalcError: [Optional]
- 0 = Do not calculate errors (default)
- 1 = Calculate errors (These calculations have a computational cost)
If CalcError = 1, GpRegressNd must be entered as an array formula. Select a range of one line by two columns starting with the GpRegressNd cell if the results are arranged in columns or select a range of two lines by one column starting with the GpRegressNd cell if the results are arranged in rows. Press F2 to start edit mode and press CTRL+SHIFT+ENTER to insert the function. If the formula is not entered as an array formula, the single result is the regression result.
Variograms
The variogram represent function dependence on parameters. Four variograms are available. The α parameter of the power variogram can be fitted on data if requested.

Available Variograms
Exponential (Variogram = 3)
Exponential variogram
Spherical (Variogram = 5)

Spherical variogram
Gaussian (Variogram = 9)

Gaussian variogram
Power (Variogram = 10)
Power variogram
With 1 ≤ β ≤ 1.99
If the parameter β (RangeOrBeta) is missing, β is calculated to fit the data.
If the parameter α (SillOrAlpha) is missing, α is calculated to fit the data.